What investors should expect when investing in infrastructure: yield

Dependable earnings growth is a core characteristic of the high-quality listed infrastructure companies in which we invest. Throughout past cycles we have seen consistent, solid returns. Given the earnings profile, operating models and potential for inflation protection that underpin these companies’ assets, we expect this to continue. Moreover, we see sustained annual returns of CPI plus 5.0% over the investment cycle ahead for this asset class.
This expected return, of approximately 7.0%-8.0% annually, can be broken down into three key components: yield, inflation protection and capital growth. Yield is one of these building blocks and is unpacked in more detail below.
High-quality listed infrastructure companies provide consistent yield
In looking at historical data, high-quality infrastructure companies in our portfolio1 delivered an average dividend yield of close to 4.0% over the past decade.
We’ve also seen that this yield moves in a tight range, through both up and down economic cycles. For example, in 2020, with the covid shock to the economy, and sizeable interest rate cuts, the average dividend yield for our portfolio1 held in a range of 3.5%-4.5%.
Subsequently, in 2022-2023, when there was an inflation surge and sharp rises in interest rates, the average yield was maintained in this range. We see similar patterns in economic cycles further back in time. For example, in the global economic upswing in 2015-2016, which saw commodity prices rally, our portfolio again recorded an average dividend yield in the 3.5%-4.0% range.
In looking at historical data, high-quality infrastructure companies in our portfolio1 delivered an average dividend yield of close to 4.0% over the past decade.
We’ve also seen that this yield moves in a tight range, through both up and down economic cycles. For example, in 2020, with the covid shock to the economy, and sizeable interest rate cuts, the average dividend yield for our portfolio1 held in a range of 3.5%-4.5%.
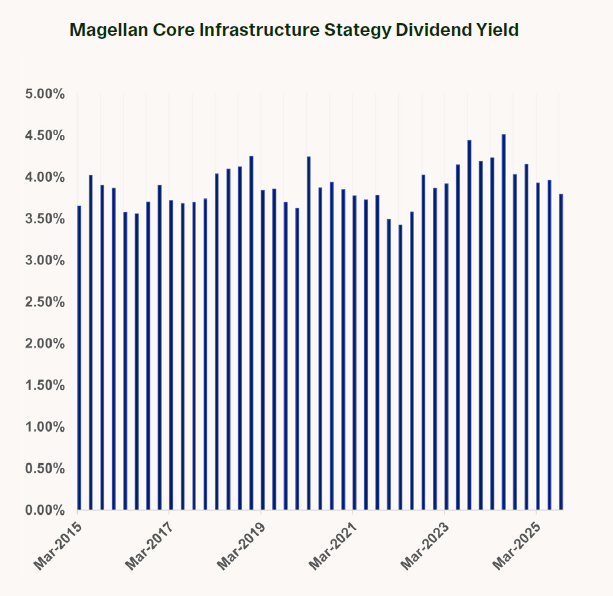
Source: Bloomberg. Magellan. The numerical information above is based on a representative portfolio. The representative portfolio is an account in the Global Core Infrastructure AUD Hedged Composite that closely reflects the portfolio management style of the strategy.
Subsequently, in 2022-2023, when there was an inflation surge and sharp rises in interest rates, the average yield was maintained in this range. We see similar patterns in economic cycles further back in time. For example, in the global economic upswing in 2015-2016, which saw commodity prices rally, our portfolio again recorded an average dividend yield in the 3.5%-4.0% range.
These examples highlight the stability of divided income yields to investors. The yield returned is consistent and largely unaffected by market cycles. Even in significant upswings and downdrafts, the yield does not deviate much from the long-term average of 4.0%. This is important, as it highlights the role of high-quality listed infrastructure as a diversifier in an investor’s portfolio.
Stable businesses support stable dividends
Infrastructure companies can deliver consistent dividends because of the nature of their underlying assets. Fundamentally, infrastructure businesses provide essential services, which support predictable demand and income (for example, water services, or electricity). Earnings are typically secured in a regulated or non-competitive structure. For example, the Magellan Global Listed Infrastructure strategy invest in companies with the bulk of earnings (75% or more) sourced from high-quality infrastructure businesses that are predominantly natural monopolies or concession-driven businesses. Demand for the services these assets provide is typically stable. At the same time, many of these businesses have a regulated component to their earnings, which varies in its breadth but provides another parameter for certainty on earnings. This includes the regulated revenue allowance for utilities, regulated toll increases for toll road operators and regulated aero revenues for airports. As a result, these companies have a relatively stable cash flow profile.
To see what this looks like in practice, let’s look at a few sub-sector examples. Toll roads illustrate this well, offering captive traffic flows and consistent revenue and earnings growth and reflecting operating leverage in their business model. The 407ETR toll road in Canada, owned by Ferrovial, is another example, shown in the chart below.
This road, like other high-quality toll road assets, captures the bulk of growth in traffic in its catchment. With the competing free road typically full at peak travel times, the toll road provides users with shorter transit times, with the added benefit that the concession allows for peak pricing and for different tolls for different segments based on demand.
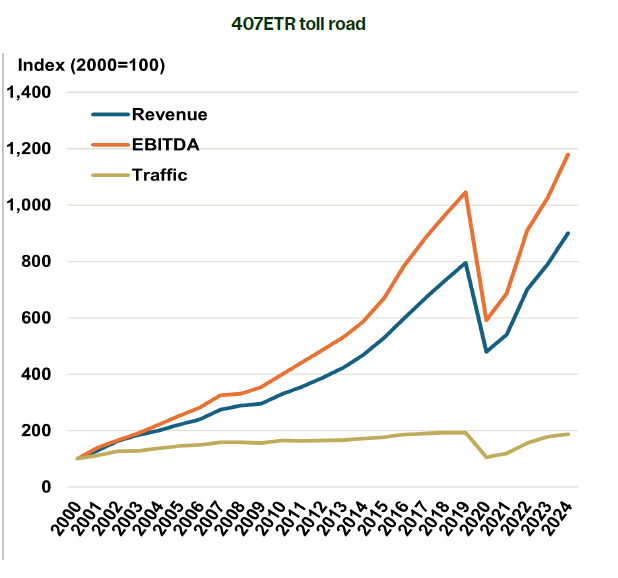
Source: Magellan analysis of company data
Regulated utilities show a similar dynamic, with their earnings linked to the growth of their regulated asset base. These companies invest in new projects, with spending approved by their regulator, to meet growing power demand, improve asset resilience, or upgrade existing infrastructure. These companies then typically earn an agreed rate of return on this asset base – of around 9.0%-10% for US integrated power companies like Xcel Energy and WEC Energy.
High-quality airports (such as European airports including Aena) operate in regimes that entitle the operating company to earn predictable returns. This includes an entitlement to earn a fair rate of return on invested capital for aviation activities and provisions for minimum annual guarantees for commercial activities, such as retail.
Looking at these examples, we can see that well-defined infrastructure companies have the advantage of high barriers to entry, pricing power and a regulated operating environment. These conditions allow these companies to have stable revenue linked to their asset base rather than to the business cycle. Under this distinct model, infrastructure companies can then pay predictable distributions to investors.
Secular trends drive yield generation
This is a snapshot of the translation of predictable demand and high-quality businesses into dividend yield at a point in time. Over time, there are clear catalysts for these companies to continue to generate yield, providing for durable returns to investors over an investment cycle.
In simple terms, steady growth in earnings over time can support higher dividends. The dividend yield can therefore comfortably hold ground for these companies, at around 4.0%. Major secular trends in the market at any given time can be linked directly to the ability of infrastructure companies to generate predictable earnings over the long term.
The rise of AI and ongoing demand for renewable energy generation are two such major trends. AI is expected to push electricity demand higher for years to come. That gives integrated utilities room to invest more, expand their asset base, and earn more on that capital. These allowable returns ultimately underpin dividends to investors. The resilience of renewable energy investment, reflecting improving cost competitiveness, also translates into greater capital investment for integrated utilities and transmission and distribution companies.
As these are regulated utilities, we see robust growth in capex again driving solid earnings growth over the longer term. Historically, this earnings growth has translated into dividend growth for investors (for example, with US regulated utilities typically recording 5.0-7.0% EPS growth, and similar dividend growth), which also helps to sustain dividend yield over time.
This is shown in the chart below for regulated utility Xcel Energy. The company demonstrates consistent dividend yield and dividend growth in the range of 5.0-7.0%, which is in line with its earnings growth over the last decade.
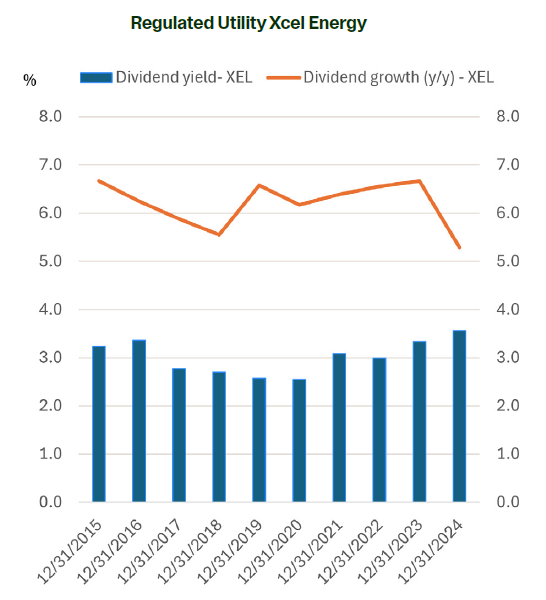
Source: Magellan analysis of company data
In addition, infrastructure businesses are highly cash generative, which supports dividend yield generation for investors over time. This is especially the case for transport infrastructure assets, which have often high levels of free cash flow. Management of these businesses can use the excess cash to maintain stable dividend yields to investors through special dividends and share repurchases, even in times of unfavourable stock price performance.
Durable yield and diversification benefits
We believe infrastructure investors can expect consistency in income over time, with some key drivers in place for self-sustainment. At around 3.5-4.5%, we view this to be an attractive income return and would highlight our expectations of limited deviations (up or down) from this dividend yield range. In fact, reflecting its business model and the nature of income streams, infrastructure is not typically seen by investors as the high-growth part of the portfolio. Rather, it plays the role of the consistent, slower-growing diversifier that can provide compounding and real capital growth over time. Infrastructure has also demonstrated outperformance in certain market environments.
We believe that high-quality listed infrastructure can be expected to provide a dividend yield of ~4.0%. This represents approximately 50%-60% of the CPI plus 5.0% return (7.0%-8.0% return) we would expect for the infrastructure asset class and underscores our confidence in achieving this outcome over the medium to long term.
By Magellan Investment Team
1 Magellan Core Infrastructure Strategy (hedged and in AUD).
Important Information: This material has been delivered to you by Magellan Asset Management Limited ABN 31 120 593 946 AFS Licence No. 304 301 trading as Magellan Investment Partners (‘Magellan Investment Partners’) and has been prepared for general information purposes only and must not be construed as investment advice or as an investment recommendation. This material does not take into account your investment objectives, financial situation or particular needs. This material does not constitute an offer or inducement to engage in an investment activity nor does it form part of any offer documentation, offer or invitation to purchase, sell or subscribe for interests in any type of investment product or service. You should obtain and consider the relevant Product Disclosure Statement (‘PDS’) and Target Market Determination (‘TMD’) and consider obtaining professional investment advice tailored to your specific circumstances before making a decision about whether to acquire, or continue to hold, the relevant financial product. A copy of the relevant PDS and TMD relating to a Magellan Investment Partners financial product may be obtained by calling +61 2 9235 4888 or by visiting www.magellaninvestmentpartners.com
Past performance is not necessarily indicative of future results and no person guarantees the future performance of any financial product or service, the amount or timing of any return from it, that asset allocations will be met, that it will be able to implement its investment strategy or that its investment objectives will be achieved. This material may contain ‘forward-looking statements’. Actual events or results or the actual performance of a Magellan Investment Partners financial product or service may differ materially from those reflected or contemplated in such forward-looking statements.
This material may include data, research and other information from third party sources. No guarantee is made that such information is accurate, complete or timely and no warranty is given regarding results obtained from its use. This information is subject to change at any time and no person has any responsibility to update any of the information provided in this material. Statements contained in this material that are not historical facts are based on current expectations, estimates, projections, opinions and beliefs of Magellan Investment Partners or the third party responsible for making those statements (as relevant). Such statements involve known and unknown risks, uncertainties and other factors, and undue reliance should not be placed thereon. No representation or warranty is made with respect to the accuracy or completeness of any of the information contained in this material. Magellan Investment Partners will not be responsible or liable for any losses arising from your use or reliance upon any part of the information contained in this material.
Any third-party trademarks contained herein are the property of their respective owners and Magellan Investment Partners claims no ownership in, nor any affiliation with, such trademarks. Any third-party trademarks contained herein are the property of their respective owners, are used for information purposes and only to identify the company names or brands of their respective owners, and no affiliation, sponsorship or endorsement should be inferred from such use. This material and the information contained within it may not be reproduced, or disclosed, in whole or in part, without the prior written consent of Magellan Investment Partners. (080825-#W17)